The Help With Assignment Blog is intended to provide with tips and tricks to students so that they are able to do better at school and college. The Blog is associated with HelpWithAssignment.com (HwA), a leading provider of online tuitions in University subjects.

Monday, February 14, 2011

Understanding Capital Structure

A company can obtain long-term financing in the form of equity, debt or a combination of both. Capital Structure is the proportion of debt and preference and equity shares on a firm’s balance sheet.

Optimal Capital Structure is the capital is the capital structure at which the weighted average cost of capital is minimum and thereby maximum value of the firm.

The relative proportions of debt, equity and other securities that a firm has outstanding constitute its capital structure. When corporations raise funds from outside investors, they must choose which type of security issue. The most common choices are financing through equity alone and financing through a combination of debt and equity.
So V = B + S = D + E


Shareholders are interested in maximizing the value of the firm’s shares. A key question is: What is the ratio of debt to equity, if any, that maximizes the shareholder’s value?
As it turns out, changes in capital structure benefit shareholders if and only if the value of the firm increases. So we concern ourselves with the question of which proportion of debt versus equity maximizes the overall value of the firm.
We assume perfect capital markets in the following analysis:
• Perfect competition
• Equal access to information
• No transaction costs
• No taxes (later we drop this assumption)

We also assume that the individual can borrow at the same rate as the firm.

Example:
We will compare a firm whose capital structure is all equity, with a firm that is identical, except that it has some debt in its capital structure.
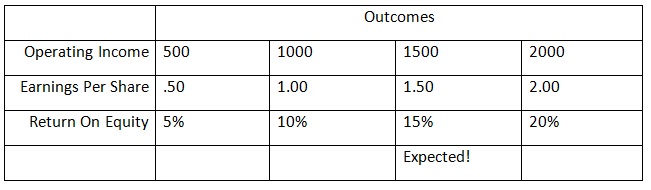
Suppose a firm has 1000 shares, a share price of $10, a market value of $10,000, and operating income as described in the table below. This income is a perpetuity, and all earnings are paid out as a dividend to investors. Expected income is $1500 and expected return is 15%.


Suppose the firm borrows $5,000 at 10% rate of interest and buys back 500 of its shares to create the following new situation: # shares 500, B = $5000, S = $5000, shares value: $10,
annual interest: $500


Argument that value has increased: If operating income is greater than $1,000 then the expected Return On Equity increases. Since we expect operating income of $1,500, leverage must have added value. Shareholders expect 20% ROE with leverage.

Counter-argument: Suppose an investor takes $10 of his/her own money and borrows $10 at 10% interest and invests the $20 to buy 2 shares of the unlevered firm.


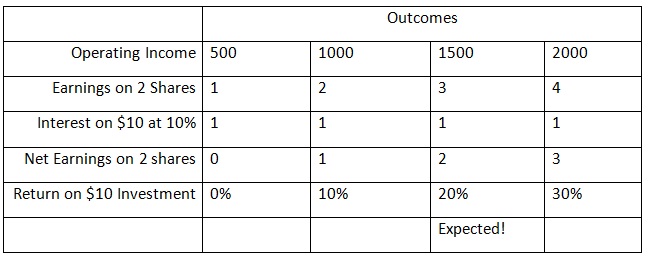
Note: Investor gets the same result from borrowing personally as he/she gets from investing in the leveraged firm. Therefore, the firm is not doing anything by leveraging that the investor could not do on his/her own. This implies VL = VU. This is the famous Modigliani-Miller Proposition I.
So leverage increases the expected earnings per share, but not the share price. How can that be?
Leverage also increases the riskiness of the earnings. We must discount those higher expected earnings at a higher discount rate.
All equity: 1.50/.15 = $10
Leveraged: 2.00/.20 = $10
Recall: The value of a firm = the PV of the future cash flows.
If the firm is all equity financed, then VU = C1/(1+r0) + C2/(1+r0)2 + … where r0 is the cost of capital of an all equity financed firm.
If there is some debt in the capital structure, the cost of capital is given by:
r = [B/(B+S)]rB + [S/(B+S)]rS where rS is the cost of equity capital of the now leveraged firm.
and VL = C1/(1+r) + C2/(1+r)2 + ...
Since the value of the company doesn’t change with leverage, VL = VU, and so r must equal r0 – that is, r must be constant as debt is added to the capital structure (remember here we are assuming no taxes etc.). The idea is that as “expensive” equity is replaced with “cheap” debt, the risk to equity increases, as a result of the increased leverage, and so rS increases. The increase in rS just balances against the increased fraction of cheaper debt, so that r stays constant.
r0 = cost of capital for the all equity firm = ra = required/expected return on the assets – reflects business risk – not financial leverage. If we solve:
r0 = (B/(B+S))rB + (S/(B+S))rS for rS, we get rS = r0 +(B/S)(r0 – rB)
This is Modigliani-Miller Proposition II.
In our example above, ra = 1500/10,000 = 15%. If B = S = 5000, then:
rS = 15% +(5000/5000)(15% - 10%) = 20%
Initially the firm was all equity, had 1,000 shares at $10/share and equity worth $10,000
V = 1500/.15 = (CF/rS) = $10,000
With $5,000 debt at 10% and $5,000 equity, now rS = 20%, up from 15% and:
V = 500/0.10 + 1000/0.20 = interest payment/rB + CF/rS = 5,000 + 5,000 = 10,000
Essentially, we split a single cash flow of 1500/year, discounted at 15% into 2 cash flows of 500 and 1000, the former discounted at 10% and the latter discounted at 20%.

At HelpWithAssignment.com we provide best quality Assignment help, Homework help, Online Tutoring and Thesis and Dissertation help as well. For any of the above services you can contact us at http://www.helpwithassignment.com/ and
http://www.helpwithassignment.com/finance-assignment-help
This article is in continuation with our previous articles on Finance which include Finance- Present Value, Finance- Net Present Value, Finance - Internal Rate of Return, Finance -Present Value Annuity

Sunday, February 13, 2011

Understanding the Cost of Capital

The Cost of Capital is defined as the rate of return that a company must offer on its securities in order to maintain its market value. Financial managers must know the cost of capital in order to (a). make capital budgeting decisions, (b). help establish the optimal capital structure and (c). make decisions concerning leasing, bond refunding and working capital management. The cost of capital is computed as a weighted average of the various capital components, items on the right hand side of the balance sheet such as debt, preferred stock, common stock and retained earnings.

Each element of capital has a component cost that is identified by the following:
ki = before tax cost of debt
k¬d = ki (1-t) = after tax cost of debt, where t = tax rate
kp = cost of preferred stock
ks = cost of retained earnings (or internal equity)
ke = cost of external equity, or cost of issuing new common stock
ko = company’s overall cost of capital , or a weighted average cost of capital
The after tax weighted average cost of capital (WACC) is given by the following formula:
WACC = ka = ke = (S/V) + kd (1-t) (D/V)


Suppose this firm faces a corporate tax rate of 40%, has variable expenses equal to 30% of sales, and has fixed costs of $158.
Working back from these requirements we can forecast the level of sales the firm must earn in order to achieve these operating results…thereby setting a sales performance target for management.
Working backwards, we get:
Sales = X
Variable Costs = .3X
Fixed Costs = 158
EBIT
Interest = 42
Taxes (40%)
Net Income = 300

If sales = X, then VC = .3X and X - .3X – 158 = EBIT
(EBIT – I)(1-T) = NI so (EBIT – 42)(1-.4) = 300 => EBIT = 542 which => X = 1000, and so VC = 300 and also Taxes = (542-42)(.4) = 200, so:

Sales = 1000
Variable costs = 300
Fixed costs = 158
EBIT = 542
Interest = 42
Taxes (40%) = 200
Net Income = 300

This working backwards process is the approach taken by regulators to set pricing for rate of return regulated industries, like utilities. So cost of capital drives utility rate increases!
Assuming earnings are a perpetuity, we have:


Firm ABC has:
Debt D of 8% annual coupon bonds with 10 years to maturity and book value of $1 m.
Preferred shares P with 10% annual dividend and book value of $1 m.
100,000 Common shares originally issued at $15/share for a value of $1.5 m.
Retained earnings of $0.5
Total of $4 m.
Market values:
The present market rate of similar risk 10 year bonds is 6% so the market value of the bonds is given by 80,000PVIFA(10 years, 6%) = [80000/.06](1-1/1.06^10) + 1,000,000/1.06^10 = $1,147,202.
Similar risk preferred shares are providing yields of 8%, so the market value of the preferred shares is 100,000/.08 = $1,250,000.
The market value of the common shares is currently $25/share, so the total market value of the shares is $2,500,000.
The market value of the firm’s balance sheet V = D + P + SE = $1,147,202 + $1,250,000 + $2,500,000 = $4,897,202 and D/V = .234, P/V = .255 and SE/V = .511.

At HelpWithAssignment.com we provide best quality Assignment help, Homework help, Online Tutoring and Thesis and Dissertation help as well. For any of the above services you can contact us at http://www.helpwithassignment.com/ and
http://www.helpwithassignment.com/finance-assignment-help
This article is in continuation with our previous articles on Finance which include Finance- Present Value, Finance- Net Present Value, Finance - Internal Rate of Return, Finance -Present Value Annuity

Friday, February 11, 2011

Market Research Techniques

Market Research is a process of investigating and answering the questions about human behavior. The key role of the market research function in an organization is to provide reliable evidence which will help managers take better decisions.

This aspect of marketing is seen differently by managers as the real marketing. Such Market Research is seen as difference between marketing and selling. Market Research is analogous with listening. Conventional theory of selling is about the salesman talking. But, real marketing begins when one listens to one’s customers. Before providing the answers one must listen to the questions.

The marketer is often faced with a degree of uncertainty and can never be quite certain that even the best laid plans will achieve their objectives in exactly the manner expected. Uncertainty is normally greater in those markets which change rapidly. Unfortunately, many markets are experiencing change frequently in the recent years.

Much of marketing intelligence in general and marketing research in particular is gathered in response to a certain stimuli. This information collected is used in the development of new products or new marketing campaigns. The first elements of information which are available for the marketer come from within the organization.

The main Internal Sources of information include: Performance Analysis, Sales Reports, Informal or Oral Reports and other Written Reports.

The External Sources of Information include: Market Research Reports, Exhibitions and Conferences, New Media, Trade Associations, Directories and Libraries.

Primary Research, Secondary Research and Explanatory Research:

Explanatory Research: The Explanatory Research is intended to verify the scenarios that have been developed. It is used for gaining background information, defining terms of research, clarifying the research problem or hypothesis and establishing research practice.

Secondary Research: In many cases a company will seek out secondary data prior to undertaking primary research. Such data or information may provide valuable insight for the research team in preparing for the primary research. However, it is important that secondary data is evaluated effectively because not all information will be reliable, relevant and/ or valid for the current research project.

Primary Research: Once the Secondary Research has been completed, any gaps in the available data should normally become obvious. These gaps will need to be filled before the data is collected and can be analyzed properly and used in the decision making process. This can be achieved only by undertaking a primary research. This may require the data to be collected of a qualitative, quantitative or pluralistic nature.

Qualitative research is the collecting, analysis and interpreting of data by observing what people say and do.

Quantitative research involves the use of structured questions where response options have been predetermined and a large number of respondents are involved.

Pluralistic research is a combination of both qualitative and quantitative research, where the advantages of both can benefit the research. It is useful to consider the use of qualitative research first as it often the most useful to marketing decision-maker.

At HelpWithAssignment.com we provide best quality Assignment help, Homework help, Online Tutoring and Thesis and Dissertation help as well. For any of the above services you can contact us at http://www.helpwithassignment.com/ and
http://www.helpwithassignment.com/marketing-assignment-help

This article is in continuation with our previous articles on Marketing Assignment help, 4Ps of Marketing, 5Cs of Marketing,

Understanding Central Tendency Properties (Mean, Median and Mode) in Statistics

In Statistics, Measures of Central Tendency are numerical values that locate, in some sense, the centre of a set of data. The term average is often associated with all measures of central tendency.

Mean
1. Measure of central tendency
2. Most common measure
3. Acts as ‘balance point’
4. Affected by extreme values (‘outliers’)
5. Formula (sample mean)

Raw Data: 10.3 4.9 8.9 11.7 6.3 7.7
X = ∑ x/n = x1 + x2 + x3 …..xn /n

Here in this case 10.3+ 4.9+ 8.9 + 11.7 +6.3 + 7.7/6 = 8.3
The mean is 8.3

Median
1. Measure of central tendency
2. Middle value in ordered sequence
• If n is odd, middle value of sequence
• If n is even, average of 2 middle values
3. Position of median in sequence
Positioning Point = n+1/2
4. Not affected by extreme values

Calculating Median from an Odd-sized example
• Raw Data: 24.1 22.6 21.5 23.7 22.6
• Ordered: 21.5 22.6 22.6 23.7 24.1
• Position: 1 2 3 4 5
Positioning Point = n+1/2 = 5+1/2 = 3
Median = 22.6
Median Example from an Even-Sized Sample
• Raw Data: 10.3 4.9 8.9 11.7 6.3 7.7
• Ordered: 4.9 6.3 7.7 8.9 10.3 11.7
• Position: 1 2 3 4 5 6
Positioning Point = n+1/2 = 6+1/2 = 3.5
Median = 7.7 + 8.9/2 = 8.3

Mode
1. Measure of central tendency
2. Value that occurs most often
3. Not affected by extreme values
4. May be no mode or several modes
5. May be used for quantitative or qualitative data

• No Mode
Raw Data: 10.3 4.9 8.9 11.7 6.3 7.7
• One Mode
Raw Data: 6.3 4.9 8.9 6.3 4.9 4.9
• More Than 1 Mode
Raw Data: 21 28 28 41 43 43

Say, if you’re a financial analyst for Prudential-Bache Securities. You have collected the following closing stock prices of new stock issues: 17, 16, 21, 18, 13, 16, 12, 11.
Describe the stock prices in terms of central tendency.

Central Tendency Solution
Mean
X = ∑x/n = 17 + 16 + 21 + 18 + 13 + 16 + 12 + 11/8 = 15.5
Median
• Raw Data: 17 16 21 18 13 16 12 11
• Ordered: 11 12 13 16 16 17 18 21
• Position: 1 2 3 4 5 6 7 8
Positioning Point = n+1/2 = 8+1/2 = 4.5
Median = 16+16/2 = 16
Mode
Raw Data: 17, 16, 21, 18, 13, 16, 12, 11
Mode = 16


At HelpWithAssignment.com we provide best quality Assignment help, Homework help, Online Tutoring and Thesis and Dissertation help as well. For any of the above services you can contact us at http://www.helpwithassignment.com/ and
http://www.helpwithassignment.com/statistics-assignment-help
This article is in continuation with our previous article on Statistics (Regression), Statistics (Correlation), Statistics (Hypothesis Testing), Statistics Assignment help

Wednesday, February 9, 2011

Understanding Statistics for Business and Economics

Understanding Statistics for Business and Economics – by www.helpwithassignment.com Team

What Is Statistics?
Statistics includes
1. Collecting Data - e.g., Survey
2. Presenting Data - e.g., Charts & Tables
3. Characterizing Data - e.g., Average
The Application Areas of Statistics include


There are 2 important types of Statistical Methods namely
Descriptive Statistics – Involves Collecting Data, Presenting Data and Characterizing Data. The main purpose is to describe data


• Inferential Statistics – involves Estimation, Hypothesis and testing. The main purpose is to make decisions about population characteristics

At HelpWithAssignment.com we provide best quality Assignment help, Homework help, Online Tutoring and Thesis and Dissertation help as well. For any of the above services you can contact us at http://www.helpwithassignment.com/ and http://www.helpwithassignment.com/statistics-assignment-help

Monday, February 7, 2011

Online Math Games For Children; Teach Math the Fun Way


Mathematics is one such subject which gives nightmares to children. Not only for children but also for mid-school students. One of the main reasons is that they do not seem to understand the concept of numbers. Teachers and parents should take it seriously and handle the issue not seriously but rather take a different approach.

One such approach is the number-games or math-games approach. Children seem to understand a subject only when there is a practical and fun side to it. Parents can try different methods like puzzle games, dice games etc.

Some websites lately have come up with interactive teaching and math-games as their specialty. These sites provide different games and try to teach them the different ways of solving problems. Thanks to these interactive sites children will let go of their fear and will develop an interest toward the subject. Once the interest in children is ignited then there is no looking back.

Some of those sites which provide math-gaming facilities are:

Math Playground: Math Playground has a variety of interactive and graphic games which teach children the basics like counting, addition, subtraction, multiplication, division and percentage calculation.

Cool Math 4 Kids: Cool Math 4 Kids has a graphical way of explaining how mathematics work. Provides good examples so that children can understand the basics and get along.

Hooda Math: Hooda Math has interesting and puzzling games for children which teach them geometry, multiplication, subtraction and other games where logical thinking can solve the problems.

Fun Based Learning: In this site one can play Math, Chemistry, English and Social Studies related games as well. Math games include algebra and puzzles, Chemistry games include quiz, chemical balancer, etc. English games include word simple scrabble like games for children, Social Studies games include Globe Navigator, Map Maker, etc.

Math-Play: Math-Play has high-level interactive games like baseball math, basketball math, geometry games, decimal games, equation games, integer games, algebra games, etc. The site has a wide range of games for all grades of Mathematics.

The Problem Site: The Problem Site has a puzzle, scrabble, fraction based, squares based games for children.

Class Brain Games: Class Brain Games a number of interactive games like Brain Racer, Santa Hangman Game, Nativity Word Games, etc. The site has not only Mathematics based games but games related to other subjects like Science, Social Studies, etc.

Lightning Reflex: Lightning Reflex has math games arranged in grade-wise manner. As the levels progress the game takes the person to the higher level and so does the complexity of the game.

HelpWithAssignment.com provides Online Tutoring, Assignment help and Homework help in Mathematics, Science, Engineering, Nursing, Biology and Management subjects through High-school, College and University. For more details visit our website http://www.helpwithassignment.com and http://www.helpwiththesis.com

This is in continuation with our previous article on Mathematics

Sunday, February 6, 2011

How Children Learn Mathematics

Children perceive things around them very differently than adults around them. Children usually learn from the visual inputs i.e., through seeing things. Somehow they rely more on their photographic memory. This is particularly seen in case of mathematics.
  • We might have observed that when we teach numbers and increment one number at a time will only confuse them more. Instead, we ask them to count on their fingers. This is because of their photographic memory.
  • It is this practical sense that will help them learn math. After teaching them how to count on their fingers we can go further and teach them how to avoid fingers and start counting in their mind. This is the hard part which is easier said than done. This transition period is a little hard for children. Give them some time to coup up with the new technique. Not all children learn and perform the same way.
  • Tell them how mathematics is used in everyday life by giving them practical examples. Take them to a store and teach them math there. Give them a ruler to and show them how the numbers progress. They will definitely understand practical part of it. Tell them how fun it is with math around. Tell them that math is not a scary animal but a friendly pet.
  • After the counting, additions and subtractions are completed, now comes the hardest part yet. The Multiplication tables. Instead of asking them to by heart the tables, teach them how multiplication tables are formed. Tell them the basis for multiplication is addition and how it works. It is sure to work.
  • Follow a similar route while dealing with fractions as well. Fractions are a little more complicated than multiplications. The parents or the teachers can use their imagination while teaching mathematics to children. This small act will make them rethink their notion about mathematics.
  • Try math-games. Math-games are one of the best methods to teach friendly math to children. Teach them measurements like pound, foot, mile, etc. Talk about time as well. Of course only after they understand multiplication.

Remember that mathematics is a practical subject and look for the appropriate examples which you think will help them understand math more clearly. The key to all these things is patience and while dealing with children who are learning mathematics, patience is that you will need to see any positive result.


At HelpWithAssignment.com we provide Mathematics online tutoring for students through K-12, College and University. Our tutors are experts with their Masters in Mathematics from the Ivy League Universities. We provide the best tutoring in Mathematics. This is the reason why 90% of our students come back to us. Our services include Assignment help, Homework help, Thesis help, Dissertation help apart from Online Tutoring.

For more details visit our website at http://www.helpwithassignment.com

Most Important Things to Carry to a College

Often most college-going students face the issues of forgetting things that are very important. It is not that they forget it from the very beginning but, the chances of forgetting things is high during last minute preparations. There are certain things that are absolutely essential, especially when the student is going to share a room.

These personal things will come in handy in most of the day to day activities. Having couple of these things will make things easier. Often the things that we take for granted will help us in simple but time consuming situations.

  • First-aid kit: A First-aid kit is one of the most important things that one needs to carry. We’re not saying that people are going to get hurt, but if something goes wrong, then a first aid kit will come in handy. Make sure that all the medicines, ointments, anti-septic liquids or creams and bandages are not empty.
  • Power cables, Plugs and Adapters: Don’t forget to pack your power cables, plugs and adapters. Will help you charge mobile, ipod and other useful things. If you are a gadget-freak, then you would definitely want to carry them.
  • Flash or Thumb drive: A flash or a thumb drive can be your life saver. Carry it always just like your wallet. It help you transfer important stuff from your friends computer to yours when you are in dire need of it.
  • Laptop lock: As the dorm rooms are shared, there is a chance that your laptop might be stolen. Don’t let that happen. Instead put a lock on it so that nobody can steal it.
  • Bathroom shoes: Carry a pair of bathroom shoes or shower shoes along. You don’t want to use dirty and unclean shoes of someone else.
  • Sewing kit: The humble needle and thread can be your life saver in times when your torn clothes can be the cause for your embarrassment. Don’t let that happen to you.
  • A small tool kit: A small tool kit will come in handy in fixing things in your dorm room as well as adding or removing hardware to your computer. Don’t carry heavy professional tool kits. Carry simple but optimum tools in terms of space and efficiency.
  • Containers and Boxes: Containers/ boxes can help you store your things like your assignment papers, books, your personal stuff, etc. Dorm rooms lack space and don’t have many cupboards, so do carry two or three of them.
  • Incense Sticks or Room Fresheners: Carry 2-3 Incense Sticks packs or Room Fresheners with you as they are needed in dorm rooms because most of the times dorm rooms are dirty and stinky places, especially boys’ rooms compared to girls rooms.
  • Rain coat and an umbrella: A rain coat and an umbrella can be useful during the rains. Carry them along with you during rainy days. You can miss the college altogether and you can’t afford to get sick and miss some important classes.
  • Spare plates, spoons, forks or chop sticks: Spare plates and spoons will be of good use if you want to eat something in the room. Especially useful for those mid-night snacks and snacks between meals.
  • Stationery Items: Stationery things like papers, pencils, pens, erasers, paperclips, sticky notes, staplers, glue, whiteners and file folders will help you through your paper work and academic work in college smoothly.
  • Baskets and detergents: Baskets and detergents will come in handy while cleaning your clothes. Wash your clothes at least once every 10-12 days. These will come in handy while washing.
  • Soap, shampoo and razors: Carry your personal hygienic stuff like soaps, shampoos and razors along with you. It’s the question of personal hygiene and health.

These are generally the things that a student requires while staying in a dorm room. This might look like a big list of things to carry. But, carrying them before hand will help you avoid unnecessary issues.

From HelpWithAssignment.com we wish all the very success to all the College and University students. For any academic assistance just visit our websites http://www.helpwithassignment.com and http://www.helpwiththesis.com

Thursday, February 3, 2011

Java at HelpWithAssignment.com (Basic Date Formatting)

Basic Date Formatting

Let us see an example for Basic Date Formatting.

package com.ack.j2se.date;
import java.text.DateFormat;
import java.text.SimpleDateFormat;
import java.util.Calendar;
import java.util.Date;
public class BasicDateFormatting {
public static void main( String[] args ) throws Exception {
// get today's date
Date today = Calendar.getInstance().getTime();

// create a short version date formatter
DateFormat shortFormatter
= SimpleDateFormat.getDateInstance( SimpleDateFormat.SHORT );

// create a long version date formatter
DateFormat longFormatter
= SimpleDateFormat.getDateInstance( SimpleDateFormat.LONG );

// create date time formatter, medium for day, long for time
DateFormat mediumFormatter
= SimpleDateFormat.getDateTimeInstance( SimpleDateFormat.MEDIUM,
SimpleDateFormat.LONG );

// use the formatters to output the dates
System.out.println( shortFormatter.format( today ) );
System.out.println( longFormatter.format( today ) );
System.out.println( mediumFormatter.format( today ) );

// convert form date -> text, and text -> date
String dateAsText = shortFormatter.format( today );
Date textAsDate = shortFormatter.parse( dateAsText );
System.out.println( textAsDate );
}
}

Here in the above coding we can see that the program is used to fetch date. Date formats are of four types, Short, Medium, Long and Full. The above functions are used to call the date and date & time formats as well.
// get today's date
Date today = Calendar.getInstance().getTime(); initializes the date function. And the following line // create a short version date formatter
DateFormat shortFormatter
This and the following lines of code are written to include the different date and date time formats. The various date and date time formats are:
SHORT is completely numeric, such as 12.13.52 or 3:30pm
MEDIUM is longer, such as Jan 12, 1952
LONG is longer, such as January 12, 1952 or 3:30:32pm
FULL is pretty completely specified, such as Tuesday, April 12, 1952 AD or 3:30:42pm PST.

At HelpWithAssignment.com we provide the best Assignment help, Homework help and Online Tutoring in Java and other Programming languages. Our tutors are experts in Java and other Programming Languages like C, C++, C#, ASP.net, JSP.net, QBasic, Perl, Fortran, etc. The list is not exhaustive.

For more details you can visit our website at http://www.helpwithassignment.com and http://www.helpwithassignment.com/programing-assignment-help
This article is in contiuation with our previous articles on Java (Finding Factorial) and Java (Finding even and odd number)

Statistics at HelpWithAssignment.com (Hypothesis Testing)

Hypothesis is making an assumption. In Statistics, a Hypothesis or an assumption is taken first and then the Hypothesis is tested whether it is accurate or not. Hypothesis testing is a study based on statistical accuracy of an experiment. If the result is positive, then it is called statistically significant.
There are two types of statistical hypotheses. A Null Hypothesis and an Alternate Hypothesis. A Null Hypothesis is denoted by H0, it is actually an assumption that the simple observations are purely from chance.
Alternate Hypothesis on the other hand is denoted by H1 or Ha, assumes that that sample is influenced by a non-random cause.
An example for Hypothesis Testing.
Suppose that we want to test the hypothesis with a significance level of .05 that the climate has changed since industrialization. Suppose that the mean temperature throughout history is 50 degrees. During the last 40 years, the mean temperature has been 51 degrees and suppose the population standard deviation is 2 degrees. What can we conclude?
We have
H0: µ = 50 or the temperature is normal
H1: µ ≠50 or the temperature has changed
We compute the z score:
(51-50)/(2/√40) = 3.16
The table gives us 0.9992
So that p = (1 – 0.9992)(2) = 0.002
Since 0.002 <0.05 We can conclude that the Alternate Hypothesis is accepted and there has been a change in temperature.

At HelpWithAssignment.com we provide best quality Assignment help, Homework help, Online Tutoring and Thesis and Dissertation help as well. For any of the above services you can contact us at http://www.helpwithassignment.com/ and http://www.helpwithassignment.com/statistics-assignment-help
This article is in continuation with our previous articles on Statistics Regression and Statistics Correlation

Essentials of Thesis Proposal

A Thesis Proposal is written to provide an idea about the work that the student wants to undertake as part of the Thesis. This is a document where in the details about the project are briefly mentioned. The details include the intention about the project, the details of the background research and a project plan.

The general body of a Thesis Proposal may contain the following points: Title, Abstract, Table of Content, Introduction, Main Body, References and Appendices.

A good Title: A good Title for the Thesis and the Proposal is required because it will demonstrate the clarity of the project and the intension of the student about the project. The result that the student aims at achieving in the project.

Abstract: An Abstract is a small summary of what is the student is intended to do in the project given the broad subject area.

Table of Contents: The Table of Contents will include the list or the page numbers of the sections from the Introduction to the appendices page. Page number accuracy is important.

The Introduction: Set the scene for the project and provide the motivation. Give the background of the area you intend to study and convince the reader about the study. One important thing that we must remember is that the introduction part appears first but, it must be written last. The introduction should include the motivation, the problem to be solved and a summary of the methodology and a hint of the solution.

Researching the background: The student is expected to research and discuss the broad context where the project is grounded. The context depends upon the nature of the proposal and the area of the application.

The Main Body: The Main Body should include the context, the goals and objectives and the methodology and evaluation. The context of the project, i.e., the where the project is placed. What are the similar publications and implementations of the project. The main body must also include goals and objectives. The tasks and deliverables that need to be done to achieve the goal and the activities those are to be undertaken to meet the deliverables. Methodology should include the research methods and the project methods that the student intends to use in order to complete the project.

Project Plan: The student needs to include a Project Plan in the Proposal which will include a work breakdown structure, a Gantt chart with critical path, milestones and slack time. This plan must be specific to the project and must have a good level of detailing.

At HelpWithThesis.com we provide Thesis help, Dissertation help, Research Proposal help, Research subject choosing help, Editing services, etc. We provide these services for College and University students. We provide this service in subjects ranging from Mathematics, Physics, Chemistry, Biology, Nursing, Engineering, Management, Marketing, Finance, Accounting, Operations Management, Strategic Management, etc. The list is not exhaustive. For more details visit our website at http://www.helpwiththesis.com for more details.

This article is in continuation with our previous articles on Dissertation, Thesis, Dissertation Proposal, Choosing a Dissertation subject

Rules for writing a Dissertation

Dissertation is the most important deliverable in an academic project. The final dissertation will be assessed by the student’s supervisor and an independent internal assessor. The recommended length of a dissertation should be between 10,000 and 15,000 words. The most important things in a project are the goals and objectives, the plan that was made and specified, the design, the implementation, the testing all these stages and processes have to be clearly mentioned from time to time.

The title, abstract, objectives, organization and general outline of the dissertation shall be determined well before the project begins. This must be approved by the student’s supervisor and then only that the student can actually begin the project work.

After the Dissertation Proposal is accepted, the project begins. The actual writing of the dissertation can start two to three months before the final deadline. The most common sections that are found in most of the dissertations are:

Abstract, table of Contents, the introduction, the main body, conclusions and references.

Abstract: The Abstract should be a 100 to 300 word summary in which the goals, the means and the outcome must be briefly described.

Table of Contents: The Table of Contents will display the structure of the dissertation and shall contain the major section and subsection headings with corresponding page numbers. The page numbers must be accurate.

Introduction: The Introduction will prepare the ground for a more detailed discussion of the following chapters. The introduction should set out briefly but clearly the goals and objectives of the project. This is the part which shall create the first impression on the project. It is advisable to write this part at the end of the project.

Main Body: The nature of the project will determine the main body of the dissertation. Most common sections can include a technical overview of related work, explains the background clearly, a critical literature review of the work in the area, a specification of the technical requirements of your project, the details of the project including the overall design and implementation of the project, the implementation of the project, the results obtained there in, the appropriate testing that was done, the evaluation and the verification of project outcomes. This is the place where the student’s depth of understanding of the project can be demonstrated.

Conclusions: The Conclusions section will contain the final results and the achievements of the project highlighting any lessons learnt or new discoveries. It must also contain the necessary steps that can extend the project in the future. In other words the scope for future developments in that particular area.

These are the general rules that a student can follow in order to write a good dissertation.

At HelpWithThesis.com we provide Thesis help, Dissertation help, Research Proposal help, Research subject choosing help, Editing services, etc. We provide these services for College and University students. We provide this service in subjects ranging from Mathematics, Physics, Chemistry, Biology, Nursing, Engineering, Management, Marketing, Finance, Accounting, Operations Management, Strategic Management, etc. The list is not exhaustive. For more details visit our website at http://www.helpwiththesis.com for more details.

This is in continuation with our previous articles on Dissertation, Thesis, Dissertation Proposal, choosing a Dissertation subject


Wednesday, February 2, 2011

Statistics at HelpWithAssignment.com (Regression)

Regression is an important concept in Statistics. Regression is used to measure the relation between two or more variables where one is independent and the others are dependant variables. Regression can be used to predict the dependant variable when the independent variable is known.
We can see an example to understand regression clearly.
Q: The regression line known as the least squares line is a plot of the expected value of the dependant variable of all values of the independent variable. In regression equation, y is always the dependant variable and x is always the independent variable.
The sales of a company (in million dollars) for each year are shown in the table below.
x (year) 2005 2006 2007 2008 2009
y (sales) 12 19 29 37 45

a) Find the least square regression line y = ax + b.
b) Use the least squares regression line as a model to estimate the sales of the company in 2012.
Sol: a) We first change the variable x into t such that t = x - 2005 and therefore t represents the number of years after 2005. Using t instead of x makes the numbers smaller and therefore manageable. The table of values becomes.
t (years after 2005) 0 1 2 3 4
y (sales) 12 19 29 37 45
a) We first change the variable x into t such that t = x - 2005 and therefore t represents the number of years after 2005. Using t instead of x makes the numbers smaller and therefore manageable. The table of values becomes.
t (years after 2005) 0 1 2 3 4
y (sales) 12 19 29 37 45
We now use the table to calculate a and b included in the least regression line formula.
t y ty t^2
0 12 0 0
1 19 19 1
2 29 58 4
3 37 111 9
4 45 180 16
Σx = 10 Σy = 142 Σxy = 368 Σx2 = 30

We now calculate a and b using the least square regression formulas for a and b.

a= (n∑t y-∑t∑y)/((n∑t^2-(∑t )^2)) =
(5×368-10×142)/((5×142-〖10〗^2)) = 8.4

b = 1/n(∑y-a∑x) = 1/5(142-8.4×10) = 11.6
b) In 2012, t = 2012 - 2005 = 7
The estimated sales in 2012 are: y = 8.4 × 7 + 11.6 = 70.4 million dollars.

At HelpWithAssignment.com we provide best quality Assignment help, Homework help, Online Tutoring and Thesis and Dissertation help as well. For any of the above services you can contact us at http://www.helpwithassignment.com/ and
http://www.helpwithassignment.com/statistics-assignment-help
This article is in continuation with our previous article on Statistics Assignment help.

Statistics at HelpWithAssignment.com (Correlation)

In Statistics Correlation denotes the relation between to variables. If change in one variable is initiating change in the other variable then it is said that there is a correlation between them. There are two kinds of correlation. One is Positive Correlation and the other is Negative Correlation.
Positive Correlation is said to exist when a change in one variable is causing a positive change in the other variable as well then it is called Positive Correlation. For example, there is said to be a Positive Correlation between Income and spending. As income increases so is the purchasing power and spending.
Negative Correlation on the other hand is a positive change in one variable causes a negative change in the other variable. The best example for this is the demand theory in Economics. We all know that when price of a product increases then the demand of that product decreases and when the price of the product decreases then the demand increases.
The result of Correlation can only range between -1.00 and +1.00. If the answer is -1.00 then it is called perfect Negative Correlation and +1.00 denotes a perfect Positive Correlation. 0.00 denotes that there is no correlation at all.
Let us understand the process of Correlation with a good example.
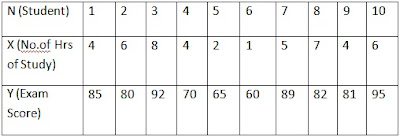
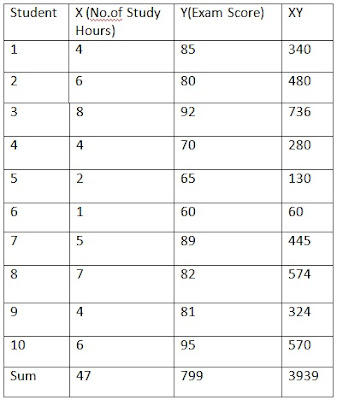
The Mean of X and Y are calculated to be 4.7 and 79.9 respectively. The Standard Deviation of X and Y are calculated to be 2.1628 and 11.5706 respectively.
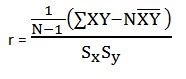
Now, the formula for Correlation Coefficient or Karl Pearsson Correlation (r) is

Here, we can observe that the ∑XY = 3939; N¯X ¯Y is the means of X and Y, calculated to be 4.7 and 79.9 respectively. Standard Deviation is denoted by Sx and Sy which are calculated to be 2.1628 and 11.5706. When we apply the values we get

r = (1/(10-1 ) (3939-10(4.7)(79.9) ))/((2.1628)(11.5706))
r = (1/(9 ) (3939-3755.3))/25.0249 = (1/(9 ) (183.7))/25.0249 = 20.4111/25.0249 =
0.8156 = 0.82

The Coefficient Determination = r2 = 0.822 = 0.67 or 67%.
Therefore, we can conclude that the score in exams is directly related to the number of hours studied to a significant extent. And we can say that there is a positive correlation between the Number of hours Studied and the Scores obtained in Exams.

At HelpWithAssignment.com we provide best quality Assignment help, Homework help, Online Tutoring and Thesis and Dissertation help as well. For any of the above services you can contact us at http://www.helpwithassignment.com/ and
http://www.helpwithassignment.com/statistics-assignment-help
This article is in continuation with our previous articles on Statistics, Statistics Assignment help.

Tuesday, February 1, 2011

C++ Programming Help at HelpWithAssignment.com (If Else Statement Example)

Here is an example of an If Else statement example. Here the situation is sales in a company. If 100 units are sold then, $0.25/unit is awarded to the sales executives and if the sales are more than 100 then for the additional units sold an additional incentive of $0.15 is given.

#include
using namespace std;
void main()
{
unsigned int Miles;
const double LessThan100 = 0.25;
const double MoreThan100 = 0.15;
double PriceLessThan100, PriceMoreThan100, TotalPrice;
cout << "Enter the number of miles: "; cin >> Miles;
if(Miles <= 100)
{
PriceLessThan100 = Miles * LessThan100;
PriceMoreThan100 = 0;
}
else
{
PriceLessThan100 = 100 * LessThan100;
PriceMoreThan100 = (Miles - 100) * MoreThan100;
}
TotalPrice = PriceLessThan100 + PriceMoreThan100;
cout << "\nTotal Price = $" << TotalPrice << "\n\n";
}


Here in the program we can see that here two constants are initiated with called the “LessThan100” and “MoreThan100”. In the first case when the sales reach up to 100 then the employee is awarded an incentive of $0.25/unit sold, which means if the sales are 85 units then the incentive would be 85 * 0.025 = 21.25.

On the other hand if the sales are more than 100 then the first 100 units are paid $0.25 and the additional units are paid $0.15. This is done by subtracting the 100 from the total sales, multiplying the 100 units with the $0.25 and the additional units is multiplied with $0.15. this gives the total incentive. For example if the sale is 135 units then the incentive would calculated as 135-100 = 35; 100 *0.25 = 25 and 35 * 0.15 = 5.25; the total incentive would be 25+5.25 = 30.25.

At HelpWithAssignment.com we provide the best quality Assignment help, Homework help and Online Tutoring in C++ and other Programming languages for College and University students. For more details visit our website at http://www.helpwithassignment.com/ http://www.helpwithassignment.com/programing-assignment-help
This is in continuation with our previous articles on C++ and C++ Assignment help

Java Programming help at HelpWithAssignment.com (Finding Factorial)

Java Factorial Example
This Java Factorial Example shows how to calculate factorial of a given number using Java.

public class NumberFactorial {
public static void main(String[] args) {

int number = 5;
/*
* Factorial of any number is !n.
* For example, factorial of 4 is 4*3*2*1.
*/

int factorial = number;

for(int i =(number - 1); i > 1; i--)

{
factorial = factorial * i;

}

System.out.println("Factorial of a number is " + factorial);
}
}

Here in the code we can see that in the first few lines the definition for a factorial is defined. Now, this definition is being applied in the following lines as “int factorial = number” or factorial of an integer equals to the number – 1; the number must be greater than 1 and the integer i is decremented by 1 until 1 is arrived at. The next process is the multiplication of the numbers obtained. This is seen in factorial = factorial*i. This will give the exact value of the factorial.

At HelpWithAssignment.com we provide the best Assignment help, Homework help and Online Tutoring in Java and other Programming languages. Our tutors are experts in Java and other Programming Languages like C, C++, C#, ASP.net, JSP.net, QBasic, Perl, Fortran, etc. The list is not exhaustive.

For more details you can visit our website at http://www.helpwithassignment.com/ and http://www.helpwithassignment.com/programing-assignment-help
You can follow us on our blogs at http://helpwithassignment.blogspot.com/ and http://helpwithassignment.wordpress.com/
This is in continuation with our previous articles on Java and Java Assignment help